System Overview
Designed and deployed a full-stack monitoring solution to provide real-time visibility into infrastructure health, application performance, and business metrics across multiple environments.
Technology Stack
- Metrics Collection: Prometheus, Node Exporter, Application metrics
- Visualization: Grafana dashboards with custom panels
- Alerting: AlertManager with multi-channel notifications
- Data Storage: InfluxDB for time-series data
- Automation: Python scripts for automated remediation
Key Features
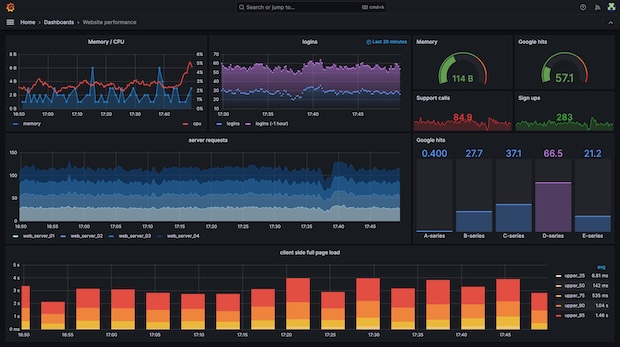
Real-time Monitoring
- Infrastructure metrics (CPU, memory, disk, network)
- Application performance monitoring (APM)
- Business KPI tracking and visualization
- Custom metric collection from APIs and databases
Intelligent Alerting
- Multi-tier alerting with escalation policies
- Integration with Slack, PagerDuty, and email
- Context-aware alerts with runbook links
- Automated incident creation and tracking
Performance Optimization
- Historical trend analysis for capacity planning
- Automated scaling recommendations
- Performance bottleneck identification
- Cost optimization insights
Impact
- 95% reduction in mean time to detection (MTTD)
- 60% faster incident resolution times
- Proactive identification of 85% of issues before customer impact
- Comprehensive visibility across 50+ services and applications
The monitoring system now serves as the central nervous system for our infrastructure, enabling proactive operations and data-driven decision making.